yes I,m only too well aware most of those reading the thread will never bother to read the links and sub-links but its your lost opportunity, to learn a great deal if you do ignore the linked info
READ THIS LINK OVER CAREFULLY TWICE
http://garage.grumpysperformance.com/index.php?threads/finding-a-machine-shop.321/#post-55314
http://www.bgsoflex.com/crchange.html
http://www.hotrod.com/techarticles/hrdp ... ewall.html
http://www.race-cars.net/calculators/co ... lator.html
viewtopic.php?f=55&t=2718&p=35577&hilit=calculators#p35577
viewtopic.php?f=55&t=8485&p=29767&hilit=calculators#p29767
viewtopic.php?f=27&t=1937&p=6234&hilit=calculators#p6234
search.php?search_id=active_topics
viewtopic.php?f=99&t=7108&p=23803&hilit=calculators#p23803
viewtopic.php?f=52&t=1070&p=20586&hilit=calculators#p20586
viewtopic.php?f=52&t=1882&p=19402&hilit=calculators#p19402
http://www.csgnetwork.com/automotiveconverters.html
viewtopic.php?f=99&t=5665&p=17217&hilit=calculators#p17217
viewtopic.php?f=52&t=4906&p=13546&hilit=calculators#p13546
viewtopic.php?f=87&t=4788&p=13003&hilit=calculators#p13003
viewtopic.php?f=52&t=181
USE THE CALCULATORS to match port size to intended rpm levels... but keep in mind valve lift and port flow limitations
http://www.wallaceracing.com/runnertorquecalc.php
http://www.wallaceracing.com/ca-calc.php
http://www.wallaceracing.com/area-under-curve.php
http://www.wallaceracing.com/chokepoint.php
http://www.wallaceracing.com/header_length.php
http://www.epi-eng.com/piston_engine_te ... torque.htm
POWER (the rate of doing WORK) is dependent on TORQUE and RPM.
TORQUE and RPM are the MEASURED quantities of engine output.
POWER is CALCULATED from torque and RPM, by the following equation:
HP = Torque x RPM ÷ 5252

Figure 3
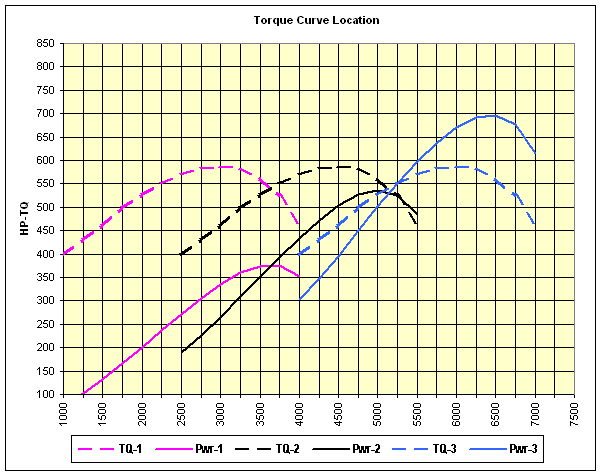
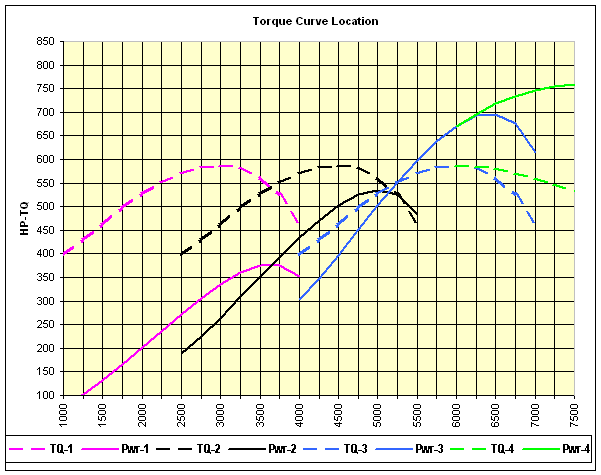
Note that, with a torque peak of 587 lb-ft at 3000 RPM, the pink power line peaks at about 375 HP between 3500 and 3750 RPM. With the same torque curve moved to the right by 1500 RPM (black, 587 lb-ft torque peak at 4500 RPM), the peak power jumps to about 535 HP at 5000 RPM. Again, moving the same torque curve to the right another 1500 RPM (blue, 587 lb-ft torque peak at 6000 RPM) causes the power to peak at about 696 HP at 6500 RPM
Using the black curves as an example, note that the engine produces 500 HP at both 4500 and 5400 RPM, which means the engine can do the same amount of work per unit time (power) at 4500 as it can at 5400. HOWEVER, it will burn less fuel to produce 450 HP at 4500 RPM than at 5400 RPM, because the parasitic power losses (power consumed to turn the crankshaft, reciprocating components, valvetrain) increases as the square of the crankshaft speed.
The RPM band within which the engine produces its peak torque is limited. You can tailor an engine to have a high peak torque with a very narrow band, or a lower peak torque value over a wider band. Those characteristics are usually dictated by the parameters of the application for which the engine is intended.
An example of that is shown in Figure 4 below. It is the same as the graph in Figure 3 (above), EXCEPT, the blue torque curve has been altered (as shown by the green line) so that it doesn't drop off as quickly. Note how that causes the green power line to increase well beyond the torque peak. That sort of a change to the torque curve can be achieved by altering various key components, including (but not limited to) cam lobe profiles, cam lobe separation, intake and/or exhaust runner length, intake and/or exhaust runner cross section. Alterations intended to broaden the torque peak will inevitable reduce the peak torque value, but the desirability of a given change is determined by the application.

READ THIS LINK OVER CAREFULLY TWICE
http://garage.grumpysperformance.com/index.php?threads/finding-a-machine-shop.321/#post-55314
http://www.bgsoflex.com/crchange.html
http://www.hotrod.com/techarticles/hrdp ... ewall.html
http://www.race-cars.net/calculators/co ... lator.html
viewtopic.php?f=55&t=2718&p=35577&hilit=calculators#p35577
viewtopic.php?f=55&t=8485&p=29767&hilit=calculators#p29767
viewtopic.php?f=27&t=1937&p=6234&hilit=calculators#p6234
search.php?search_id=active_topics
viewtopic.php?f=99&t=7108&p=23803&hilit=calculators#p23803
viewtopic.php?f=52&t=1070&p=20586&hilit=calculators#p20586
viewtopic.php?f=52&t=1882&p=19402&hilit=calculators#p19402
http://www.csgnetwork.com/automotiveconverters.html
viewtopic.php?f=99&t=5665&p=17217&hilit=calculators#p17217
viewtopic.php?f=52&t=4906&p=13546&hilit=calculators#p13546
viewtopic.php?f=87&t=4788&p=13003&hilit=calculators#p13003
viewtopic.php?f=52&t=181
USE THE CALCULATORS to match port size to intended rpm levels... but keep in mind valve lift and port flow limitations
http://www.wallaceracing.com/runnertorquecalc.php
http://www.wallaceracing.com/ca-calc.php
http://www.wallaceracing.com/area-under-curve.php
http://www.wallaceracing.com/chokepoint.php
http://www.wallaceracing.com/header_length.php
http://www.epi-eng.com/piston_engine_te ... torque.htm
POWER (the rate of doing WORK) is dependent on TORQUE and RPM.
TORQUE and RPM are the MEASURED quantities of engine output.
POWER is CALCULATED from torque and RPM, by the following equation:
HP = Torque x RPM ÷ 5252

Figure 3
Note that, with a torque peak of 587 lb-ft at 3000 RPM, the pink power line peaks at about 375 HP between 3500 and 3750 RPM. With the same torque curve moved to the right by 1500 RPM (black, 587 lb-ft torque peak at 4500 RPM), the peak power jumps to about 535 HP at 5000 RPM. Again, moving the same torque curve to the right another 1500 RPM (blue, 587 lb-ft torque peak at 6000 RPM) causes the power to peak at about 696 HP at 6500 RPM
Using the black curves as an example, note that the engine produces 500 HP at both 4500 and 5400 RPM, which means the engine can do the same amount of work per unit time (power) at 4500 as it can at 5400. HOWEVER, it will burn less fuel to produce 450 HP at 4500 RPM than at 5400 RPM, because the parasitic power losses (power consumed to turn the crankshaft, reciprocating components, valvetrain) increases as the square of the crankshaft speed.
The RPM band within which the engine produces its peak torque is limited. You can tailor an engine to have a high peak torque with a very narrow band, or a lower peak torque value over a wider band. Those characteristics are usually dictated by the parameters of the application for which the engine is intended.
An example of that is shown in Figure 4 below. It is the same as the graph in Figure 3 (above), EXCEPT, the blue torque curve has been altered (as shown by the green line) so that it doesn't drop off as quickly. Note how that causes the green power line to increase well beyond the torque peak. That sort of a change to the torque curve can be achieved by altering various key components, including (but not limited to) cam lobe profiles, cam lobe separation, intake and/or exhaust runner length, intake and/or exhaust runner cross section. Alterations intended to broaden the torque peak will inevitable reduce the peak torque value, but the desirability of a given change is determined by the application.

