You posted the graph below in my engine project thread and I’ve been looking at the graph trying to make sense it.
viewtopic.php?f=69&t=3814&p=13500#p13500
What does this graph telling me ??? If I’m looking at the left vertical axis (Intake Flow in CFM) the calculation would
appears to be the same as figuring Carb Size, except the numbers are no where close. For one 50 cu in cylinder engine
at 75%, 100% VE, the Carb size would be 54 and 72 CFM. The graph show nearly 200 CFM. And then there the 25 Inches of Water.
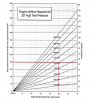
See graph below with red lines.
For example, using a 400 cu in V8, then on the horizontal axis we would use 50 cu in (400/8=50). Going straight up until
it intersects the 5000 RPM line, on the left vertical axis is ~ 200 CFM and on the right axis is 53 HP/Cyl.
Can you shed some light on how the calculations were done? What kind of assumptions were made ?