I've had this question asked a dozen times, for decades guys were told that if the intake port size on the cylinder heads they select are too large they will loose a great deal of off idle response and lower rpm drive-ability, or if the port size in the cylinder heads they select are too large the turbo they use won,t spool up quickly, contributing too noticeable turbo lag. obviously factors like, engine displacement ,valve curtain area, cam timing valve size, valve lift and duration, compression , and exhaust scavenging all effect results, but if your plenum is in positive boost your less restricted by lack of lower rpm port speeds at lower rpms, or in reliance on exhaust scavenging of the cylinders,
short answer, in almost all cases a larger volume intake port cross sectional area's,
larger valves , some port and bowl area clean-up port work, and a larger free flow exhaust helps a turbo boosted engine.
I can tell you that I have seen a very noticeable boost in power on a friends car when we swapped from mildly ported stock 260cc BBC heads to a set of 315 cc small rectangle port heads that had larger valves on his twin turbo 427 engine.
he swears, the difference was very obvious even from the front seat, and he picked up almost 4 tenths in the 1/4 mile. from low 10s to deep in the 9s
http://garage.grumpysperformance.co...ads-tuned-intake-turbulence.12998/#post-67611
http://garage.grumpysperformance.co...-calculators-and-basic-math.10705/#post-50173
http://garage.grumpysperformance.com/index.php?threads/port-and-runner-math.148/#post-34936
http://garage.grumpysperformance.co...at-angles-and-air-flow.8460/page-2#post-33298
http://garage.grumpysperformance.co...build-the-engine-to-match-the-cam-specs.11764
https://mechanics.stackexchange.com...runner-length-effect-the-power-curve-of-a-car
https://www.musclecardiy.com/performance/induction-math-high-performance-engines/
http://www.superchevy.com/how-to/en...-0902-chevy-engine-port-variations-measuring/
http://www.wallaceracing.com/lpv.php
http://www.wallaceracing.com/ca-calc.php
http://www.wallaceracing.com/calcafhp.php
http://www.wallaceracing.com/machcalc.php
http://www.wallaceracing.com/calcdchg.php
http://www.wallaceracing.com/curtain-area-calc.php
http://garage.grumpysperformance.co...-size-and-intake-for-nitrous.4930/#post-13633
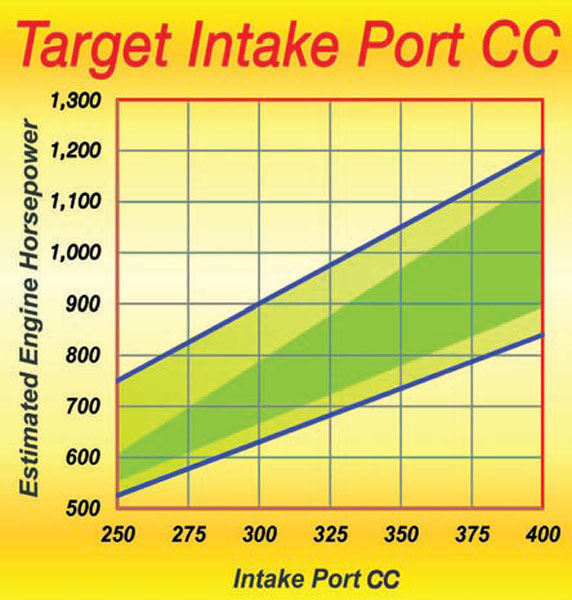
USE THE CALCULATORS to match port size to intended rpm levels... but keep in mind valve lift and port flow limitations[/color]
http://www.wallaceracing.com/runnertorquecalc.php
http://www.wallaceracing.com/ca-calc.php
http://www.wallaceracing.com/area-under-curve.php
http://www.wallaceracing.com/chokepoint.php
http://www.wallaceracing.com/header_length.php
https://www.cartechbooks.com/techtips/cylinder-head-math-for-engine-performance/

Next to power adders, performance cylinder heads are the most powerful investment you can make. Take careful note of the formulas in this chapter. They will help you understand and evaluate the broad selection of cylinder heads available for your performance project.
Converting Combustion Chamber Sizes
Cylinder head combustion chambers are cc’d for the purpose of calculating compression ratios and to verify equal volume in each chamber. For the compression ratio formula (see Chapter 3) you need to convert measured cubic centimeters to cubic inches. There are several conversions to choose from.
Chamber size = measured cc x 0.0610237
That’s a lot of numbers to remember and a lot of keys to punch on your calculator, so most engine builders use the following alternate formula.
Chamber size = measured cc ÷ 16.4
The exact conversion is 16.387064, but the difference is negligible and won’t normally affect your final calculation. Check out the following examples using all three versions of the conversion factor to calculate the size (in cubic inches) of a 64-cc combustion chamber.
64 x 0.0610237 = 3.9055 ci
64 ÷ 16.4 = 3.9024 ci
64 ÷ 16.387064 = 3.9055 ci
Note that 16.4 is a rounded number that is easiest to keep in your head. In practice the difference is so slight that it won’t affect your compression ratio calculation, so most people opt for the shortcut.
Evaluating Port Volumes
There are no real formulas to work here, but quantifying the difference among cylinder head port cubic centimeters is important if you have performed any porting or cleanup work in the ports. Most performance cylinder heads have published volumes that are usually pretty accurate. You can verify them by cc’ing each port the same way you do a combustion chamber. Install an intake valve using a light checking spring and retainer to hold the valve closed. Many heads have a hole in the port roof that has been drilled and tapped to accept a rocker stud above the port. For accuracy, you should install the rocker stud and its pushrod guide plate (if there is one) to plug the hole to the correct depth. Then cc the port as described in Chapter 3. Since intake ports hold considerably more volume than combustion chambers, it is helpful to have a graduated burette with greater capacity, say, 250 cc, if possible. Otherwise you have to stop the flow of checking fluid at zero and refill the burette one or more times to complete the job. To promote equal work from each cylinder, you want to ensure equal port volumes, and that’s why you have to check them if you have done any work in the port or valve bowl area.
Many street engine builders like to clean up the roughness in the bowl area just above the valve and match the port openings to the intake manifold, but they take great care not to alter the cross-sectional area of the valve throat venturi where the rectangular or oval-shaped port makes the transition to a circular shape just above the valve seat. Minor blending into the valve seat is all that’s required. Altering the area without knowledge and experience can ruin a good port and you would never know it without comparison flow bench work. A better choice for most DIY builders would be to verify what you’ve already got by cc’ing all the ports and comparing them by percentage.

This cutaway port shows the extent of the volume you are measuring. Check the port roof for open rocker stud holes that may exist in your particular casting. Plug them with a stud and sealer prior to cc'ing. Be sure to include the guide plate to position the stud depth correctly.

Measure port volume the same way you measure chamber volume (see Chapter 3). Since port volumes are often three or more times chamber volume, you may want to consider a graduated burette with more capacity. Chemical supply houses on the Internet are a good source.
% port difference = cc larger port ÷ cc smaller port x 100
Compare the following measured ports on a typical performance cylinder head that has been bowl ported and intake matched.
Cylinder 1 Cylinder 2 Cylinder 3 Cylinder 4
cc 190.2 190.8 192.3 191.0
% 100 100.3 101.1 100.4
All four ports are close and the minor differences are probably not enough to matter for most street applications. The larger difference on cylinder 3 is likely caused by an attempt to match the intake runner that required the removal of more material than anticipated. In most cases you would let it slide, but it can become an issue on certain applications such as a big-block Chevy where you are dealing with the old good port/bad port scenario. In this case you want to be extra careful not to harm the velocity characteristics of the bad ports. It is problematic because anything you do will likely increase volume and impact port velocity. The results can only be verified on a flow bench, which adds to your expense. For most street applications you can probably accept the as-cast port volumes with maybe a slight cleanup as long as port volume difference is held to about 1 percent.

Calculating Valve Curtain Area
When contemplating engine combinations and camshafts in particular, it is often useful to calculate the valve curtain area for a given valve lift and compare it to proposed changes by percentage. The valve curtain area is the area of the flow window that opens when the valve is lifted off its seat. Say you have a 2.02-inch intake valve that opens to 0.500-inch lift. What is the valve curtain area and how much will it increase if you open the valve to 0.535 inch?
To perform the calculation correctly you can’t go by the valve diameter itself. You have to go by the flow diameter, which is where the actual valve seat begins. This is usually about 0.040-inch smaller than the average valve diameter. For most calculations it’s pretty accurate to simply multiply the valve diameter by 0.98. The calculation then becomes the valve diameter times 0.98 times pi times the lift value. The result is the total available flow area for the valve’s flow diameter at the given valve lift.
Valve curtain area = valve diameter x 0.98 x 3.14 x valve lift or per our example: 2.02 x 0.98 x 3.14 x 0.500 = 3.107 square inches
To find the percentage of change divide the new valve lift by the current valve lift or do the same with the calculated valve curtain areas.
% = 0.535 ÷ 0.500 = 1.07, or a 7-percent increase in valve lift
Now the valve curtain areas: 2.02 x 0.98 x 3.14 x 0.500 = 3.107 square inches 2.02 x 0.98 x 3.14 x 0.535 = 3.325 square inches % = 3.32 ÷ 3.10 = 1.07, or a 7-percent increase in available flow area It is important to recognize that this does not represent a 7-percent increase in flow (you wish), but rather a 7-percent increase in potential flow area. Flow gains are still dictated by the combination of available flow area, port velocity and cross-sectional area, valve job, opening rate, and other factors influencing the induction system. The additional flow area relative to valve opening rate and duration offers increased potential for overall cylinder filling. Increasing the valve lift to 0.550 yields a 10-percent increase in valve lift and available flow area. Again, it does not mean a 10-percent increase in airflow, but rather a 10- percent increase in flow area and, thus, flow potential. Any actual increase would have to be verified on a flow bench.

The open valve creates a flow window or so-called valve curtain that provides flow area according to its circumference at the flow diameter times the amount of total valve lift. Calculate it using the diameter of the outer edge of the valve seat, not the overall diameter of the valve.

This cutaway view shows the valve curtain area so you can visualize the flow window of the open valve.
Another important thing to consider is the saturation point of the port with regard to valve curtain area versus port cross-sectional area. It’s typically somewhere in the mid-lift range (roughly 0.300 to 0.400 inch) for most applications. Beyond this point, the valve curtain area becomes larger than the port cross-sectional area (c/s) and the port itself becomes the restriction. You can determine this point with the following formula:
Valve curtain vs. port saturation lift point = valve lift x port c/s ÷ valve curtain area Example: for a 2.02-inch valve at 0.400 lift and a port cross-sectional area of 2.15 square inches measured at the hump in the port wall adjacent to the pushrod.
Valve Curtain Area = 2.02 x 0.98 x 3.14 x 0.400 = 2.486 square inches
Port c/s = 1.87 x 1.15 = 2.15 square inches Saturation Point = (0.400 x 2.15) ÷ 2.486 = 0.346-inch lift
So 0.346 inch lift is the point where the valve curtain area exactly equals the port cross-sectional area. Above this valve lift the port cross section becomes the controlling factor in flow capacity. (For an in-depth look at how much this affects cylinder head performance, take a look at Chevy Small-Block Cylinder Heads by Graham Hansen, published by CarTech.)
Calculating Optimum Port Area from Valve Size
The primary objective of all performance cylinder heads is to produce the maximum possible volumetric efficiency across the broadest possible range of engine speed. That’s why port and valve sizes are so critical and so easy to mess up without careful deliberation. The intake port crosssectional area (c/s) describes the smallest area of a port in a perpendicular plane to the flow upstream of the valve. There are two schools of thought on this. Depending on the cylinder head, the smallest cross section may actually be the venturi diameter or throat area directly above the valve seat. This is particularly true if you also consider the additional obstruction of the valve guide and valve stem. Others define cross-sectional area as the choke point farther upstream near the bump in the port wall adjacent to the pushrod. To determine this you measure the vertical and horizontal dimensions at that point and multiply to find the area.
Port c/s Area = height x width
To find the area of the valve throat (venturi) simply measure the diameter of the throat opening above the valve seat and calculate the area as follows:
Throat Area = Pi x radius2 Throat Area = diameter2 x 0.7854
Head porters contend that the upstream cross-sectional area (in the port itself) should be 90 percent of the flow diameter of the intake valve for a race engine and 0.85 percent for a street engine. Some feel that 90 percent is good across the board. This is based on the valve’s flow diameter at the inner edge of the valve seat. It’s a reasonable assumption although the throat diameter directly above the valve seat may be even smaller and that is what the air actually sees. And it doesn’t account for the partial blockage caused by the valve guide and stem. For now however, we are simply relating port cross-sectional area in the port itself to the flow diameter at the valve seat.
For example, a 2.02-inch intake valve has a flow diameter of 1.717 inches if we’re going by the 85-percent rule. To calculate the equivalent port cross-sectional area, use the following formula.
Flow Diameter for Street Engine = valve diameter x 0.85
2.05 x 0.85 = 1.7425 inches
Port Area = (flow diameter2 ÷ 4) x 3.1417
(1.74252 ÷ 4) x 3.1417 = 2.38 square inches

Measure the valve flow diameter at the outer edge of the valve seat with dial calipers. If this is not possible, you can estimate it by subtracting 0.040 inch from overall diameter or by multiplying valve diameter by 0.98.
At 85-percent flow diameter ratio, the flow diameter is calling for a minimum cross-sectional area of 2.38 square inches in the port. To keep that in perspective, note that a 195-cc Air Flow Research cylinder head for a small-block Chevy has a 2.02-inch intake valve and a 2.21-square-inch cross-sectional area in the port. This is smaller than our calculation, but close. If we were to use the 90-percent rule it calls for a port c/s of 2.59 square inches, which is even larger.
It can be surmised that they’re keeping it tight to preserve port velocity and they may also be considering the restriction of the valve stem. Up to a point, giving up CFM for port velocity is usually acceptable because velocity moves a fuel charge more effectively than area.
Calculating Minimum Port Area
Another way of evaluating port cross-sectional area comes from the (now out of print) SA-Design book DeskTop Dynos by Larry Atherton. His formula for calculating minimum port cross-sectional area offers an alternative method of estimating the minimum requirement based on cylinder volume times engine speed divided by an empirical constant of 190,000.
Minimum Port c/s Area = (bore2 x stroke x RPM) ÷ 190,000
A 350-ci engine with a 4-inch bore and a 3.48-inch stroke running at 6,000 rpm calculates as follows:
Area = (4.002 x 3.48 x 6,000) ÷ 190,000 = 1.758 square inches
That’s almost dead on with a Chevy 492 casting, which has a cross-sectional area of 1.76 square inches. Many performance heads have larger cross-sectional port areas because they are trying to move as much air as possible while still maintaining port velocity. It is a delicate balance to strike and some do it better than others. It would be great to know the port velocity at the choke point, but it is rarely measured outside of an engine lab and calculating it would be difficult, particularly with a plenum involved upstream of the manifold runner. Atherton’s formula provides a conservative but useful calculation of port area that lets you ballpark the minimum acceptable restriction based on engine size and RPM.
Calculating Port Velocity
If you know the cross-sectional area of a given port you can calculate the port velocity based on the bore diameter and the piston speed at any given RPM using the following formula.
Port Velocityfps = (Ps ÷ 60) x (B2 ÷ Ap)
Where:
Ps = piston speed in feet per minute
B = bore diameter in inches
Ap = area of port in square inches
The first part of the formula converts the piston speed to feet per second while the second half relates the bore area to the port cross section. Consider the following example: A 3-inch-stroke 302-ci engine running at 4,400 rpm (torque peak) achieves a piston speed of 2,200 feet per minute at that point. The bore is 4.00 inches and the port cross section is 2.44 square inches.
Pvel = (2,200 ÷ 60) x (4.002 ÷ 2.44) = 240.4 feet per second
Estimating Peak Engine Speed from Airflow
SuperFlow Corporation (manufacturers of airflow benches, engine dynos, and chassis dynos) provides a handy formula for estimating the engine speed at peak power based on airflow and engine displacement. It uses empirically derived constants or VE factors to project peak-power RPM. Street engines use a VE factor of 1,196, while race engines use a larger factor of 1,316. A third factor of 1,256 is also provided for more highly tuned street/strip applications.

Measure the valve throat diameter (venturi) with a pair of dial calipers or a telescoping snap gauge. It should be close to 90 percent of the intake valve diameter.

To calculate port velocity, measure the port entry and exit and average the two area measurements to obtain Ap. Then plug in the mean piston speed and bore size to find the mean port velocity.
It should be noted that these factors are only valid if you have airflow figures for a complete inlet tract at 28 inches of water. That means flowing the cylinder head with the intake manifold and carburetor attached to give the flow bench a look at the entire system. Say you have a 400-ci engine and you are able to obtain an appropriately measured flow value of 240 cfm through the complete inlet tract. Calculate the predicted peak engine speed based on the following formula and one of the three VE factors. For this example we’ll use the street/strip factor.
VE Factors
1,196 = stock engine
1,256 = street/strip engine
1,316 = race engine
RPM = (VE factor ÷ displacement of 1 cylinder) x CFM
First divide 400 ci by 8 to get the displacement of one cylinder. It’s 50 ci in this case.
RPM = (1,256 ÷ 50) x 240 = 6,028
(For more information about this formula and results from real-world applications, see How to Build Max Performance Pontiac V-8s by Jim Hand, published by CarTech.)
Predicting Horsepower from Airflow
Another SuperFlow-sourced formula along the same lines uses airflow through a complete system to predict peak horsepower. If you have already obtained the appropriate flow values and predicted your peak engine speed, you can use the same flow value to estimate peak power. I first learned of this simple formula from former SuperFlow Vice President Harold Bettes more than twenty years ago and have seen its prediction come pretty close many times. SuperFlow developed power coefficients for each of the most widely used flow bench test pressures. Again, remember that they are only accurate if you have airflow measurements through a complete inlet system.
Horsepower = observed CFM x power coefficient x number of cylinders
Power For Flow at Coefficient Inches of Water
0.43 10
0.35 15
0.27 25
0.26 28
Assuming a cylinder head with manifold and open carburetor attached, we observe a net flow of 225 cfm when tested on a flow bench at 28 inches of water. The corresponding power coefficient is 0.26.
Horsepower = 225 x 0.26 x 8 = 468
For best results you would want to verify flow numbers through several different ports.
Looking at Valve-Lift-to-Diameter Ratios
SuperFlow also pioneered a method for evaluating different valve diameters based on lift settings that are in direct ratio to their diameter. The lift-to-diameter (L/D) ratio provides ideal valve lift test settings that permit valve diameter flow comparisons based on common ratios. These ratios are 0.05:1, 0.10:1, 0.15:1, 0.20:1, 0.25:1, and 0.30:1. Ideal test valve lift settings are derived by multiplying the valve diameter by the desired L/D ratio. (See table on page 87.) To compare different size valves accurately, you first must select a common L/D ratio. A good choice would be one that yields a test valve lift that is about 65 percent of your total valve lift, since that is the point where the most flow occurs relative to valve open time.
Say you want to compare a 1.94-inch valve to a 2.02- inch valve, and you know that your total net lift is 0.450 inch. Multiply 0.450 times 0.65 to get the lift at 65 percent. That comes out to 0.292 lift. On the chart under the 1.94-inch intake valve column we find an L/D ratio of 0.15:1 that recommends a test lift setting of 0.291 inch. Note that the valve diameter of 1.94 inch multiplied by the L/D ratio (0.15) equals 0.291 inch.


SuperFlow’s FlowCom digital analyzer automates most of the data collection process. The software correlates and presents the collected data for easy analysis.
To make an accurate flow comparison with a 2.02-inch valve, you use the same L/D ratio, which indicates 0.303- inch lift on the chart (2.02 x 0.15 = 0.303). Why more lift for the bigger valve? Because the flow increase is proportional. Testing at the same lift as the 1.94–inch valve would show a flow increase, but perhaps not as much as the 2.02-inch valve is actually capable of delivering.
That might lead you to think that it is not worth switching valves. Ask your flow technician to make the flow comparison using the appropriate L/D ratio to get an accurate picture of the valve’s performance in proportion to the smaller valve. Then you truly know the flow value of the larger valve and can make a more informed decision.
Comparing Flow at Different Test Pressures
SuperFlow is a primary manufacturer of airflow test benches and flow bench equipment. Their standard test pressure (water depression) is 25 inches, but most of the performance industry tests at 28 inches of water. For comparison purposes, SuperFlow developed a conversion chart for converting flow numbers at any test pressure to equivalent flow numbers at any desired test pressure.
Follow the chart below to select an appropriate conversion factor or do the math to calculate your own factor. If you have flow at a lower pressure (usually the case) and wish to convert to flow at a higher pressure, divide the higher pressure by the lower pressure and take the square root to obtain your conversion multiplier.
Conversion Factor = √(higher test pressure ÷ lower test pressure)
You can verify this on the chart. Note that in some cases the chart uses a rounded number. For example, convert flow at 25 inches to flow at 28 inches.
Conversion Factor = √(28 ÷ 25) = 1.058
SuperFlow rounds this off to 1.06 on the chart. Now calculate an actual airflow conversion assuming 245-cfm flow through an intake port at 25 inches, and we want to convert it to equivalent flow at the performance industry standard of 28 inches.
Flow at Known Test Pressure x Conversion Factor = flow at desired test pressure
245 cfm x 1.06 = 259.7 cfm at 28 inches
The difference is minimal, so using rounded figures from the chart is perfectly acceptable. All the work has been done for you.

The SuperFlow 600 is the most commonly used airflow bench in the performance world. It has the capacity, accuracy, and repeatability to test all modern performance cylinder heads.


For even greater accuracy, it is often instructional to flow a cylinder head with the intake manifold attached. Some testers even install the carburetor with the throttle plates locked open to simulate the complete intake path.

Performance Trends’ Port Flow Analyzer Pro software allows you to match flow curves with camshaft profiles to create “flow area” curves that can help you evaluate a port’s suitability for torque and horsepower potential. It is designed to interface with SuperFlow’s Flowcom electronics and PT’s automated valve opener to further computerize your flow bench testing.
Now suppose you have 259-cfm flow taken at 28 inches and you want to convert it to flow at 25 inches. Just take the reciprocal of the known conversion factor. In this case:
Reciprocal = 1 ÷ 1.06 = 0.943
This is rounded to 0.945 on the chart. Multiply 259 cfm by 0.945 to get 245 cfm.
259 x 0.945 = 244.75 (round to 245 cfm)
In most cases you can rely on the chart for your conversion factor, although SuperFlow does stress that greater accuracy is derived if the conversion range is smaller. So comparing 25 inches to 28 inches is more precise than comparing 10 inches to 25 inches. If you are testing on a SuperFlow flow bench equipped with the FlowCom digital analyzer, you can view these changes in the software. You can also make these conversions with Performance Trends Port Flow Analyzer software, which integrates easily with the FlowCom system.
Understanding Exhaust-to-Intake Ratio
The exhaust-to-intake (E/I) ratio is often misunderstood. Some still believe that it is the ratio of the exhaust valve diameter to the diameter of the intake valve, but we’re not concerned with the ratio of valve size, which is largely dictated by available bore size. The E/I ratio is a percentage taken by dividing measured exhaust flow by intake flow at the same valve lift. This provides an index that can be used to compare cylinder heads based on flow efficiency.
E/I = exhaust flow at same lift ÷ intake flow at same lift
Example: 197 cfm @ 0.400 ÷ 247 cfm @ 0.400 = 80% E/I
Good heads usually fall somewhere in the 75- to 80-percent range, but this number typically varies according to lift. It may be 80 percent at mid-lift, but only 74 percent at peak lift as port efficiency diminishes. If you are able to obtain flow data on different heads, select those with the best E/I at the midpoint of your anticipated valve lift. While the valve sees peak lift only once per intake cycle, it sees mid-lift twice (in a sense) as it opens and closes. This is your point of greatest flow potential and it should be exploited with the best possible E/I ratio.
Most people don’t ever consider many of the things discussed in this chapter, but by investigating them thoroughly prior to purchasing your heads, you ensure that you get the best possible package for your specific application.
If you wonder why the exhaust valve is always smaller than the intake valve, the answer is simple. On the intake side you’re dealing with low pressure and relatively slow velocities. The exhaust valve operates under high temperature, high pressure, and more velocity. We have to coax the mixture into the cylinder on the intake side, but on the exhaust side it can’t wait to get out.
short answer, in almost all cases a larger volume intake port cross sectional area's,
larger valves , some port and bowl area clean-up port work, and a larger free flow exhaust helps a turbo boosted engine.
I can tell you that I have seen a very noticeable boost in power on a friends car when we swapped from mildly ported stock 260cc BBC heads to a set of 315 cc small rectangle port heads that had larger valves on his twin turbo 427 engine.
he swears, the difference was very obvious even from the front seat, and he picked up almost 4 tenths in the 1/4 mile. from low 10s to deep in the 9s
http://garage.grumpysperformance.co...ads-tuned-intake-turbulence.12998/#post-67611
http://garage.grumpysperformance.co...-calculators-and-basic-math.10705/#post-50173
http://garage.grumpysperformance.com/index.php?threads/port-and-runner-math.148/#post-34936
http://garage.grumpysperformance.co...at-angles-and-air-flow.8460/page-2#post-33298
http://garage.grumpysperformance.co...build-the-engine-to-match-the-cam-specs.11764
https://mechanics.stackexchange.com...runner-length-effect-the-power-curve-of-a-car
https://www.musclecardiy.com/performance/induction-math-high-performance-engines/
http://www.superchevy.com/how-to/en...-0902-chevy-engine-port-variations-measuring/
http://www.wallaceracing.com/lpv.php
http://www.wallaceracing.com/ca-calc.php
http://www.wallaceracing.com/calcafhp.php
http://www.wallaceracing.com/machcalc.php
http://www.wallaceracing.com/calcdchg.php
http://www.wallaceracing.com/curtain-area-calc.php
http://garage.grumpysperformance.co...-size-and-intake-for-nitrous.4930/#post-13633
USE THE CALCULATORS to match port size to intended rpm levels... but keep in mind valve lift and port flow limitations[/color]
http://www.wallaceracing.com/runnertorquecalc.php
http://www.wallaceracing.com/ca-calc.php
http://www.wallaceracing.com/area-under-curve.php
http://www.wallaceracing.com/chokepoint.php
http://www.wallaceracing.com/header_length.php
https://www.cartechbooks.com/techtips/cylinder-head-math-for-engine-performance/
Next to power adders, performance cylinder heads are the most powerful investment you can make. Take careful note of the formulas in this chapter. They will help you understand and evaluate the broad selection of cylinder heads available for your performance project.
Converting Combustion Chamber Sizes
Cylinder head combustion chambers are cc’d for the purpose of calculating compression ratios and to verify equal volume in each chamber. For the compression ratio formula (see Chapter 3) you need to convert measured cubic centimeters to cubic inches. There are several conversions to choose from.
Chamber size = measured cc x 0.0610237
That’s a lot of numbers to remember and a lot of keys to punch on your calculator, so most engine builders use the following alternate formula.
Chamber size = measured cc ÷ 16.4
The exact conversion is 16.387064, but the difference is negligible and won’t normally affect your final calculation. Check out the following examples using all three versions of the conversion factor to calculate the size (in cubic inches) of a 64-cc combustion chamber.
64 x 0.0610237 = 3.9055 ci
64 ÷ 16.4 = 3.9024 ci
64 ÷ 16.387064 = 3.9055 ci
Note that 16.4 is a rounded number that is easiest to keep in your head. In practice the difference is so slight that it won’t affect your compression ratio calculation, so most people opt for the shortcut.
Evaluating Port Volumes
There are no real formulas to work here, but quantifying the difference among cylinder head port cubic centimeters is important if you have performed any porting or cleanup work in the ports. Most performance cylinder heads have published volumes that are usually pretty accurate. You can verify them by cc’ing each port the same way you do a combustion chamber. Install an intake valve using a light checking spring and retainer to hold the valve closed. Many heads have a hole in the port roof that has been drilled and tapped to accept a rocker stud above the port. For accuracy, you should install the rocker stud and its pushrod guide plate (if there is one) to plug the hole to the correct depth. Then cc the port as described in Chapter 3. Since intake ports hold considerably more volume than combustion chambers, it is helpful to have a graduated burette with greater capacity, say, 250 cc, if possible. Otherwise you have to stop the flow of checking fluid at zero and refill the burette one or more times to complete the job. To promote equal work from each cylinder, you want to ensure equal port volumes, and that’s why you have to check them if you have done any work in the port or valve bowl area.
Many street engine builders like to clean up the roughness in the bowl area just above the valve and match the port openings to the intake manifold, but they take great care not to alter the cross-sectional area of the valve throat venturi where the rectangular or oval-shaped port makes the transition to a circular shape just above the valve seat. Minor blending into the valve seat is all that’s required. Altering the area without knowledge and experience can ruin a good port and you would never know it without comparison flow bench work. A better choice for most DIY builders would be to verify what you’ve already got by cc’ing all the ports and comparing them by percentage.
This cutaway port shows the extent of the volume you are measuring. Check the port roof for open rocker stud holes that may exist in your particular casting. Plug them with a stud and sealer prior to cc'ing. Be sure to include the guide plate to position the stud depth correctly.
Measure port volume the same way you measure chamber volume (see Chapter 3). Since port volumes are often three or more times chamber volume, you may want to consider a graduated burette with more capacity. Chemical supply houses on the Internet are a good source.
% port difference = cc larger port ÷ cc smaller port x 100
Compare the following measured ports on a typical performance cylinder head that has been bowl ported and intake matched.
Cylinder 1 Cylinder 2 Cylinder 3 Cylinder 4
cc 190.2 190.8 192.3 191.0
% 100 100.3 101.1 100.4
All four ports are close and the minor differences are probably not enough to matter for most street applications. The larger difference on cylinder 3 is likely caused by an attempt to match the intake runner that required the removal of more material than anticipated. In most cases you would let it slide, but it can become an issue on certain applications such as a big-block Chevy where you are dealing with the old good port/bad port scenario. In this case you want to be extra careful not to harm the velocity characteristics of the bad ports. It is problematic because anything you do will likely increase volume and impact port velocity. The results can only be verified on a flow bench, which adds to your expense. For most street applications you can probably accept the as-cast port volumes with maybe a slight cleanup as long as port volume difference is held to about 1 percent.
Calculating Valve Curtain Area
When contemplating engine combinations and camshafts in particular, it is often useful to calculate the valve curtain area for a given valve lift and compare it to proposed changes by percentage. The valve curtain area is the area of the flow window that opens when the valve is lifted off its seat. Say you have a 2.02-inch intake valve that opens to 0.500-inch lift. What is the valve curtain area and how much will it increase if you open the valve to 0.535 inch?
To perform the calculation correctly you can’t go by the valve diameter itself. You have to go by the flow diameter, which is where the actual valve seat begins. This is usually about 0.040-inch smaller than the average valve diameter. For most calculations it’s pretty accurate to simply multiply the valve diameter by 0.98. The calculation then becomes the valve diameter times 0.98 times pi times the lift value. The result is the total available flow area for the valve’s flow diameter at the given valve lift.
Valve curtain area = valve diameter x 0.98 x 3.14 x valve lift or per our example: 2.02 x 0.98 x 3.14 x 0.500 = 3.107 square inches
To find the percentage of change divide the new valve lift by the current valve lift or do the same with the calculated valve curtain areas.
% = 0.535 ÷ 0.500 = 1.07, or a 7-percent increase in valve lift
Now the valve curtain areas: 2.02 x 0.98 x 3.14 x 0.500 = 3.107 square inches 2.02 x 0.98 x 3.14 x 0.535 = 3.325 square inches % = 3.32 ÷ 3.10 = 1.07, or a 7-percent increase in available flow area It is important to recognize that this does not represent a 7-percent increase in flow (you wish), but rather a 7-percent increase in potential flow area. Flow gains are still dictated by the combination of available flow area, port velocity and cross-sectional area, valve job, opening rate, and other factors influencing the induction system. The additional flow area relative to valve opening rate and duration offers increased potential for overall cylinder filling. Increasing the valve lift to 0.550 yields a 10-percent increase in valve lift and available flow area. Again, it does not mean a 10-percent increase in airflow, but rather a 10- percent increase in flow area and, thus, flow potential. Any actual increase would have to be verified on a flow bench.
The open valve creates a flow window or so-called valve curtain that provides flow area according to its circumference at the flow diameter times the amount of total valve lift. Calculate it using the diameter of the outer edge of the valve seat, not the overall diameter of the valve.
This cutaway view shows the valve curtain area so you can visualize the flow window of the open valve.
Another important thing to consider is the saturation point of the port with regard to valve curtain area versus port cross-sectional area. It’s typically somewhere in the mid-lift range (roughly 0.300 to 0.400 inch) for most applications. Beyond this point, the valve curtain area becomes larger than the port cross-sectional area (c/s) and the port itself becomes the restriction. You can determine this point with the following formula:
Valve curtain vs. port saturation lift point = valve lift x port c/s ÷ valve curtain area Example: for a 2.02-inch valve at 0.400 lift and a port cross-sectional area of 2.15 square inches measured at the hump in the port wall adjacent to the pushrod.
Valve Curtain Area = 2.02 x 0.98 x 3.14 x 0.400 = 2.486 square inches
Port c/s = 1.87 x 1.15 = 2.15 square inches Saturation Point = (0.400 x 2.15) ÷ 2.486 = 0.346-inch lift
So 0.346 inch lift is the point where the valve curtain area exactly equals the port cross-sectional area. Above this valve lift the port cross section becomes the controlling factor in flow capacity. (For an in-depth look at how much this affects cylinder head performance, take a look at Chevy Small-Block Cylinder Heads by Graham Hansen, published by CarTech.)
Calculating Optimum Port Area from Valve Size
The primary objective of all performance cylinder heads is to produce the maximum possible volumetric efficiency across the broadest possible range of engine speed. That’s why port and valve sizes are so critical and so easy to mess up without careful deliberation. The intake port crosssectional area (c/s) describes the smallest area of a port in a perpendicular plane to the flow upstream of the valve. There are two schools of thought on this. Depending on the cylinder head, the smallest cross section may actually be the venturi diameter or throat area directly above the valve seat. This is particularly true if you also consider the additional obstruction of the valve guide and valve stem. Others define cross-sectional area as the choke point farther upstream near the bump in the port wall adjacent to the pushrod. To determine this you measure the vertical and horizontal dimensions at that point and multiply to find the area.
Port c/s Area = height x width
To find the area of the valve throat (venturi) simply measure the diameter of the throat opening above the valve seat and calculate the area as follows:
Throat Area = Pi x radius2 Throat Area = diameter2 x 0.7854
Head porters contend that the upstream cross-sectional area (in the port itself) should be 90 percent of the flow diameter of the intake valve for a race engine and 0.85 percent for a street engine. Some feel that 90 percent is good across the board. This is based on the valve’s flow diameter at the inner edge of the valve seat. It’s a reasonable assumption although the throat diameter directly above the valve seat may be even smaller and that is what the air actually sees. And it doesn’t account for the partial blockage caused by the valve guide and stem. For now however, we are simply relating port cross-sectional area in the port itself to the flow diameter at the valve seat.
For example, a 2.02-inch intake valve has a flow diameter of 1.717 inches if we’re going by the 85-percent rule. To calculate the equivalent port cross-sectional area, use the following formula.
Flow Diameter for Street Engine = valve diameter x 0.85
2.05 x 0.85 = 1.7425 inches
Port Area = (flow diameter2 ÷ 4) x 3.1417
(1.74252 ÷ 4) x 3.1417 = 2.38 square inches
Measure the valve flow diameter at the outer edge of the valve seat with dial calipers. If this is not possible, you can estimate it by subtracting 0.040 inch from overall diameter or by multiplying valve diameter by 0.98.
At 85-percent flow diameter ratio, the flow diameter is calling for a minimum cross-sectional area of 2.38 square inches in the port. To keep that in perspective, note that a 195-cc Air Flow Research cylinder head for a small-block Chevy has a 2.02-inch intake valve and a 2.21-square-inch cross-sectional area in the port. This is smaller than our calculation, but close. If we were to use the 90-percent rule it calls for a port c/s of 2.59 square inches, which is even larger.
It can be surmised that they’re keeping it tight to preserve port velocity and they may also be considering the restriction of the valve stem. Up to a point, giving up CFM for port velocity is usually acceptable because velocity moves a fuel charge more effectively than area.
Calculating Minimum Port Area
Another way of evaluating port cross-sectional area comes from the (now out of print) SA-Design book DeskTop Dynos by Larry Atherton. His formula for calculating minimum port cross-sectional area offers an alternative method of estimating the minimum requirement based on cylinder volume times engine speed divided by an empirical constant of 190,000.
Minimum Port c/s Area = (bore2 x stroke x RPM) ÷ 190,000
A 350-ci engine with a 4-inch bore and a 3.48-inch stroke running at 6,000 rpm calculates as follows:
Area = (4.002 x 3.48 x 6,000) ÷ 190,000 = 1.758 square inches
That’s almost dead on with a Chevy 492 casting, which has a cross-sectional area of 1.76 square inches. Many performance heads have larger cross-sectional port areas because they are trying to move as much air as possible while still maintaining port velocity. It is a delicate balance to strike and some do it better than others. It would be great to know the port velocity at the choke point, but it is rarely measured outside of an engine lab and calculating it would be difficult, particularly with a plenum involved upstream of the manifold runner. Atherton’s formula provides a conservative but useful calculation of port area that lets you ballpark the minimum acceptable restriction based on engine size and RPM.
Calculating Port Velocity
If you know the cross-sectional area of a given port you can calculate the port velocity based on the bore diameter and the piston speed at any given RPM using the following formula.
Port Velocityfps = (Ps ÷ 60) x (B2 ÷ Ap)
Where:
Ps = piston speed in feet per minute
B = bore diameter in inches
Ap = area of port in square inches
The first part of the formula converts the piston speed to feet per second while the second half relates the bore area to the port cross section. Consider the following example: A 3-inch-stroke 302-ci engine running at 4,400 rpm (torque peak) achieves a piston speed of 2,200 feet per minute at that point. The bore is 4.00 inches and the port cross section is 2.44 square inches.
Pvel = (2,200 ÷ 60) x (4.002 ÷ 2.44) = 240.4 feet per second
Estimating Peak Engine Speed from Airflow
SuperFlow Corporation (manufacturers of airflow benches, engine dynos, and chassis dynos) provides a handy formula for estimating the engine speed at peak power based on airflow and engine displacement. It uses empirically derived constants or VE factors to project peak-power RPM. Street engines use a VE factor of 1,196, while race engines use a larger factor of 1,316. A third factor of 1,256 is also provided for more highly tuned street/strip applications.
Measure the valve throat diameter (venturi) with a pair of dial calipers or a telescoping snap gauge. It should be close to 90 percent of the intake valve diameter.
To calculate port velocity, measure the port entry and exit and average the two area measurements to obtain Ap. Then plug in the mean piston speed and bore size to find the mean port velocity.
It should be noted that these factors are only valid if you have airflow figures for a complete inlet tract at 28 inches of water. That means flowing the cylinder head with the intake manifold and carburetor attached to give the flow bench a look at the entire system. Say you have a 400-ci engine and you are able to obtain an appropriately measured flow value of 240 cfm through the complete inlet tract. Calculate the predicted peak engine speed based on the following formula and one of the three VE factors. For this example we’ll use the street/strip factor.
VE Factors
1,196 = stock engine
1,256 = street/strip engine
1,316 = race engine
RPM = (VE factor ÷ displacement of 1 cylinder) x CFM
First divide 400 ci by 8 to get the displacement of one cylinder. It’s 50 ci in this case.
RPM = (1,256 ÷ 50) x 240 = 6,028
(For more information about this formula and results from real-world applications, see How to Build Max Performance Pontiac V-8s by Jim Hand, published by CarTech.)
Predicting Horsepower from Airflow
Another SuperFlow-sourced formula along the same lines uses airflow through a complete system to predict peak horsepower. If you have already obtained the appropriate flow values and predicted your peak engine speed, you can use the same flow value to estimate peak power. I first learned of this simple formula from former SuperFlow Vice President Harold Bettes more than twenty years ago and have seen its prediction come pretty close many times. SuperFlow developed power coefficients for each of the most widely used flow bench test pressures. Again, remember that they are only accurate if you have airflow measurements through a complete inlet system.
Horsepower = observed CFM x power coefficient x number of cylinders
Power For Flow at Coefficient Inches of Water
0.43 10
0.35 15
0.27 25
0.26 28
Assuming a cylinder head with manifold and open carburetor attached, we observe a net flow of 225 cfm when tested on a flow bench at 28 inches of water. The corresponding power coefficient is 0.26.
Horsepower = 225 x 0.26 x 8 = 468
For best results you would want to verify flow numbers through several different ports.
Looking at Valve-Lift-to-Diameter Ratios
SuperFlow also pioneered a method for evaluating different valve diameters based on lift settings that are in direct ratio to their diameter. The lift-to-diameter (L/D) ratio provides ideal valve lift test settings that permit valve diameter flow comparisons based on common ratios. These ratios are 0.05:1, 0.10:1, 0.15:1, 0.20:1, 0.25:1, and 0.30:1. Ideal test valve lift settings are derived by multiplying the valve diameter by the desired L/D ratio. (See table on page 87.) To compare different size valves accurately, you first must select a common L/D ratio. A good choice would be one that yields a test valve lift that is about 65 percent of your total valve lift, since that is the point where the most flow occurs relative to valve open time.
Say you want to compare a 1.94-inch valve to a 2.02- inch valve, and you know that your total net lift is 0.450 inch. Multiply 0.450 times 0.65 to get the lift at 65 percent. That comes out to 0.292 lift. On the chart under the 1.94-inch intake valve column we find an L/D ratio of 0.15:1 that recommends a test lift setting of 0.291 inch. Note that the valve diameter of 1.94 inch multiplied by the L/D ratio (0.15) equals 0.291 inch.
SuperFlow’s FlowCom digital analyzer automates most of the data collection process. The software correlates and presents the collected data for easy analysis.
To make an accurate flow comparison with a 2.02-inch valve, you use the same L/D ratio, which indicates 0.303- inch lift on the chart (2.02 x 0.15 = 0.303). Why more lift for the bigger valve? Because the flow increase is proportional. Testing at the same lift as the 1.94–inch valve would show a flow increase, but perhaps not as much as the 2.02-inch valve is actually capable of delivering.
That might lead you to think that it is not worth switching valves. Ask your flow technician to make the flow comparison using the appropriate L/D ratio to get an accurate picture of the valve’s performance in proportion to the smaller valve. Then you truly know the flow value of the larger valve and can make a more informed decision.
Comparing Flow at Different Test Pressures
SuperFlow is a primary manufacturer of airflow test benches and flow bench equipment. Their standard test pressure (water depression) is 25 inches, but most of the performance industry tests at 28 inches of water. For comparison purposes, SuperFlow developed a conversion chart for converting flow numbers at any test pressure to equivalent flow numbers at any desired test pressure.
Follow the chart below to select an appropriate conversion factor or do the math to calculate your own factor. If you have flow at a lower pressure (usually the case) and wish to convert to flow at a higher pressure, divide the higher pressure by the lower pressure and take the square root to obtain your conversion multiplier.
Conversion Factor = √(higher test pressure ÷ lower test pressure)
You can verify this on the chart. Note that in some cases the chart uses a rounded number. For example, convert flow at 25 inches to flow at 28 inches.
Conversion Factor = √(28 ÷ 25) = 1.058
SuperFlow rounds this off to 1.06 on the chart. Now calculate an actual airflow conversion assuming 245-cfm flow through an intake port at 25 inches, and we want to convert it to equivalent flow at the performance industry standard of 28 inches.
Flow at Known Test Pressure x Conversion Factor = flow at desired test pressure
245 cfm x 1.06 = 259.7 cfm at 28 inches
The difference is minimal, so using rounded figures from the chart is perfectly acceptable. All the work has been done for you.
The SuperFlow 600 is the most commonly used airflow bench in the performance world. It has the capacity, accuracy, and repeatability to test all modern performance cylinder heads.
For even greater accuracy, it is often instructional to flow a cylinder head with the intake manifold attached. Some testers even install the carburetor with the throttle plates locked open to simulate the complete intake path.
Performance Trends’ Port Flow Analyzer Pro software allows you to match flow curves with camshaft profiles to create “flow area” curves that can help you evaluate a port’s suitability for torque and horsepower potential. It is designed to interface with SuperFlow’s Flowcom electronics and PT’s automated valve opener to further computerize your flow bench testing.
Now suppose you have 259-cfm flow taken at 28 inches and you want to convert it to flow at 25 inches. Just take the reciprocal of the known conversion factor. In this case:
Reciprocal = 1 ÷ 1.06 = 0.943
This is rounded to 0.945 on the chart. Multiply 259 cfm by 0.945 to get 245 cfm.
259 x 0.945 = 244.75 (round to 245 cfm)
In most cases you can rely on the chart for your conversion factor, although SuperFlow does stress that greater accuracy is derived if the conversion range is smaller. So comparing 25 inches to 28 inches is more precise than comparing 10 inches to 25 inches. If you are testing on a SuperFlow flow bench equipped with the FlowCom digital analyzer, you can view these changes in the software. You can also make these conversions with Performance Trends Port Flow Analyzer software, which integrates easily with the FlowCom system.
Understanding Exhaust-to-Intake Ratio
The exhaust-to-intake (E/I) ratio is often misunderstood. Some still believe that it is the ratio of the exhaust valve diameter to the diameter of the intake valve, but we’re not concerned with the ratio of valve size, which is largely dictated by available bore size. The E/I ratio is a percentage taken by dividing measured exhaust flow by intake flow at the same valve lift. This provides an index that can be used to compare cylinder heads based on flow efficiency.
E/I = exhaust flow at same lift ÷ intake flow at same lift
Example: 197 cfm @ 0.400 ÷ 247 cfm @ 0.400 = 80% E/I
Good heads usually fall somewhere in the 75- to 80-percent range, but this number typically varies according to lift. It may be 80 percent at mid-lift, but only 74 percent at peak lift as port efficiency diminishes. If you are able to obtain flow data on different heads, select those with the best E/I at the midpoint of your anticipated valve lift. While the valve sees peak lift only once per intake cycle, it sees mid-lift twice (in a sense) as it opens and closes. This is your point of greatest flow potential and it should be exploited with the best possible E/I ratio.
Most people don’t ever consider many of the things discussed in this chapter, but by investigating them thoroughly prior to purchasing your heads, you ensure that you get the best possible package for your specific application.
If you wonder why the exhaust valve is always smaller than the intake valve, the answer is simple. On the intake side you’re dealing with low pressure and relatively slow velocities. The exhaust valve operates under high temperature, high pressure, and more velocity. We have to coax the mixture into the cylinder on the intake side, but on the exhaust side it can’t wait to get out.
Last edited: