You are using an out of date browser. It may not display this or other websites correctly.
You should upgrade or use an alternative browser.
You should upgrade or use an alternative browser.
Tuning a TBucket Dart 400 cuin Engine
- Thread starter Indycars
- Start date
8
87vette81big
Guest
The Info expanded by Grumpy on Progression Circuits is Where its at Rick.
Also known as the POWER VALVE.
TYPICALLY YOU DON'T MESS WITH EMULSION CIRCUITS UNLESS A SUPER RADICAL RACE CAMSHAFT IS USED.
BE 255- 280 DEGREES @.050" Duration.
Overlap 85 -120 degrees.
I know the T-bucker Crower grind Grumpy chose is not that Hot.
Dont need to. T is Light weight.
Also known as the POWER VALVE.
TYPICALLY YOU DON'T MESS WITH EMULSION CIRCUITS UNLESS A SUPER RADICAL RACE CAMSHAFT IS USED.
BE 255- 280 DEGREES @.050" Duration.
Overlap 85 -120 degrees.
I know the T-bucker Crower grind Grumpy chose is not that Hot.
Dont need to. T is Light weight.
personally ID agree with BRIAN on that point,
swapping jets,
changes too power valves ,
adjusting or swapping accelerator pumps
and accelerator pump cam changes,
different booster designs if required,
and secondary throttle plate control adjustments can get you where you need to be,
I was running in the low 10 second range at 136-137 mph back in the mid 1970s
with what by todays standards where archic parts,
and a good understanding of how to tune a crower injected big block engine!
yeah! I had stack injection on the car,
but I ran only a bit slower ,(about 3 tenths) similar numbers with a dual plane intake and a holley three barrel carb
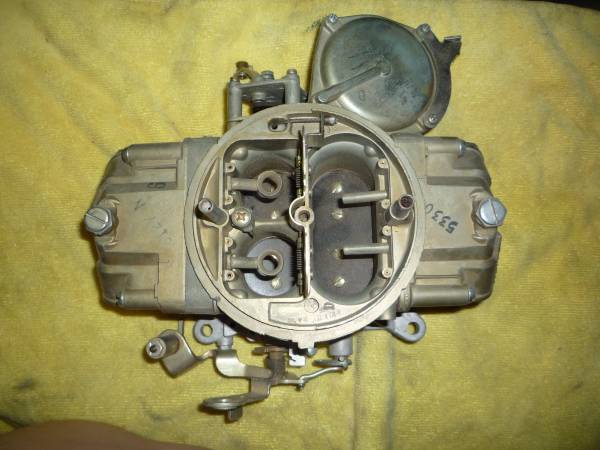
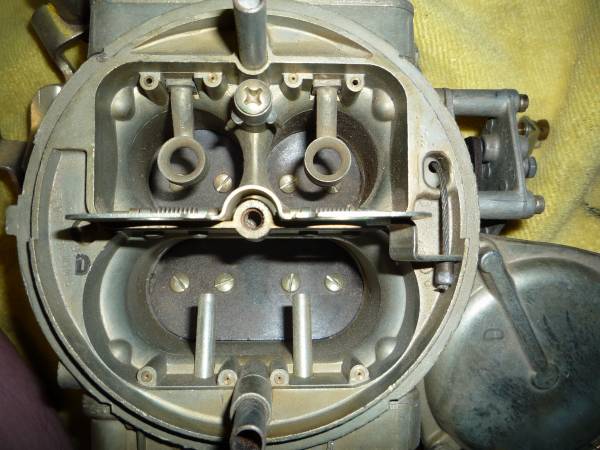
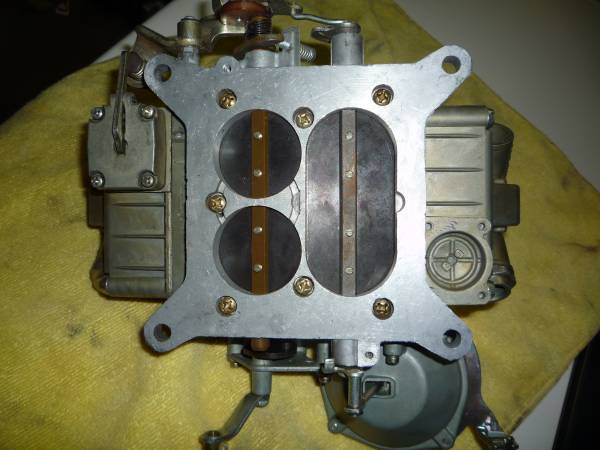
http://garage.grumpysperformance.com/index.php?threads/the-holley-three-barrel-carb.3037/
swapping jets,
changes too power valves ,
adjusting or swapping accelerator pumps
and accelerator pump cam changes,
different booster designs if required,
and secondary throttle plate control adjustments can get you where you need to be,
I was running in the low 10 second range at 136-137 mph back in the mid 1970s
with what by todays standards where archic parts,
and a good understanding of how to tune a crower injected big block engine!
yeah! I had stack injection on the car,
but I ran only a bit slower ,(about 3 tenths) similar numbers with a dual plane intake and a holley three barrel carb
http://garage.grumpysperformance.com/index.php?threads/the-holley-three-barrel-carb.3037/
Last edited:
bytor
Well-Known Member
I'm beginning to think it's the emulsion tube. I tried the HSAB because it was easy and
I wanted to see the effects of the HSAB's. So I made a big change of 3.5 times more
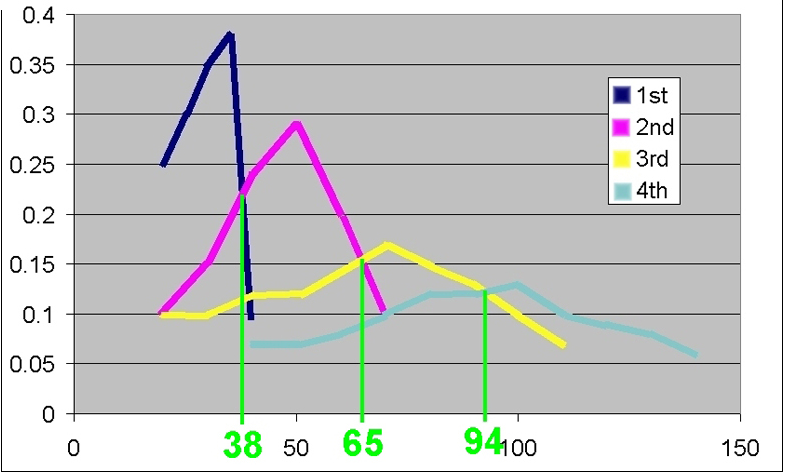
I wouldn't tinker with the emulsion holes just yet. Your curve looks mostly flat if you leave the idle and secondary transitions out of the picture with a slight tilt going from rich to lean. Try a .026-.028 HSAB and see what the results are. Generally, as you increase the HSAB, the main circuit starts richer and leans towards WOT (green line). The opposite happens as you reduce the HSAB by starting lean and richen up towards WOT (purple line).
The orange line is a more realistic non-leaner representation of the HSAB affect on the AFR the green and purple show the overall effect.
You can also see the HSAB has the most affect on the AFR curve (both startup and WOT).. Orange Line
The upper E-hole has the most effect the primary circuit startup and a slight effect towards WOT.. Yellow Line
The lower E-hole has no effect on the primary circuit start, it only effects WOT.. Pink Line
You will have to adjust your primary and secondary jet's when you make changes to the HSAB's. If you increase the HSAB, you will need to increase the jet's a few sizes. You will need smaller jets if you decrease the HSAB.

busterrm
solid fixture here in the forum
I had it backwards on the HSABs, going richer is what I meant.I wouldn't tinker with the emulsion holes just yet. Your curve looks mostly flat if you leave the idle and secondary transitions out of the picture with a slight tilt going from rich to lean. Try a .026-.028 HSAB and see what the results are. Generally, as you increase the HSAB, the main circuit starts richer and leans towards WOT (green line). The opposite happens as you reduce the HSAB by starting lean and richen up towards WOT (purple line).
The orange line is a more realistic non-leaner representation of the HSAB affect on the AFR the green and purple show the overall effect.
You can also see the HSAB has the most affect on the AFR curve (both startup and WOT).. Orange Line
The upper E-hole has the most effect the primary circuit startup and a slight effect towards WOT.. Yellow Line
The lower E-hole has no effect on the primary circuit start, it only effects WOT.. Pink Line
You will have to adjust your primary and secondary jet's when you make changes to the HSAB's. If you increase the HSAB, you will need to increase the jet's a few sizes. You will need smaller jets if you decrease the HSAB.
View attachment 6039
Before all the input from everyone, I had already run a test with a Lower eHole change
from .031" to .040". This seemed to flatten out the curve on the high RPM (past 6 secs)
section. So then I tried a .060" Lower eHole, but there was NO detectable change. Upon
inspection of the hole under the brass set screw, it is smaller than .040", therefore it's the
limiting factor now.

Based on all the feedback I received (THANKS !) I made several changes this time. This is
the first time to ever make more than one change.
Below is a table with the final changes for the next test run. I made all the changes last night,
but didn't have time for the test. So tonight I will run the test and report back on the results.

I may have learned something about comparing plots that effects all my comparisons above.
Since the TIME scale changes with each plot, that alone could make the plots appear to flatten
out if more time is included or get steeper if less time is included. That's why it's important to
put both plots of the same parameter(ie AFR) on a grid where the time scale is equal for both
plots of the same parameter, such as AFR.
Clear as mud ...... right!
from .031" to .040". This seemed to flatten out the curve on the high RPM (past 6 secs)
section. So then I tried a .060" Lower eHole, but there was NO detectable change. Upon
inspection of the hole under the brass set screw, it is smaller than .040", therefore it's the
limiting factor now.
Based on all the feedback I received (THANKS !) I made several changes this time. This is
the first time to ever make more than one change.
Below is a table with the final changes for the next test run. I made all the changes last night,
but didn't have time for the test. So tonight I will run the test and report back on the results.
I may have learned something about comparing plots that effects all my comparisons above.
Since the TIME scale changes with each plot, that alone could make the plots appear to flatten
out if more time is included or get steeper if less time is included. That's why it's important to
put both plots of the same parameter(ie AFR) on a grid where the time scale is equal for both
plots of the same parameter, such as AFR.
Clear as mud ...... right!
"Clear as mud ...... right!"
NO! actually thats MANDATORY in making a valid comparison between charts,
if the conditions under which your testing are not consistent ,
and the factors being tested, accurately being measured, your mostly wasting your time!
if the testing conditions or parameters such as time, or duration of the tests,
speeds atained, gear change rpm points,engine coolant, air temps, fuel pressure, air temperature, traction loads , weight of the car, fuel octane, spark plug gaps and length of the test in BOTH distance traveled and time spent under wot acceleration,
are not consistent between the individual tests, the validity of those results and data gleened,and your ability to draw valid concluesions,
can be and probably ARE tainted or virtually useless for comparing results gained or the effect of the changes.
thats one very populay way manufacturers use in advertizing too skew the results of tests to show THEIR PRODUCT is HIGHLY SUPERIOR to the competition,
alter the test conditions and youll get far different results, don,t bother to mention the test was a rigged game and you can make almost any test result a basically worthless statistic for a comparison,and a smart advertizing department will take FULL ADVANTAGE of that fact!
one pet peve I have is reading magazine dyno comparisons where they point out the noticable "improvement in engine performance" but don,t point out those little details that happened durring the testing or how they RIGGED the game by careful selection of either the test conditions or matching the parts combo to precisely fit one component they are promoting and knowing that the other manufacturers component was designed for a different operational enviroment, OR
rigging the results through subtle changes, in the set-up,
more than one magazine test result failed to mention minor changes that were made, during test runs, like running a base line et/speed test in a GTO with a full tank of gas,and a camera man in the pass seat, and spark plugs with 20K miles on them, then changing the spark plugs and making a second pass without the camera man on board, but taking pictures as the car runs past, and amazingly the spark plug change allows a gain or over a tenth in the E.T and over 1 mph in the lights!
related info
http://garage.grumpysperformance.co...sue-based-on-mis-information.6414/#post-49916
http://garage.grumpysperformance.co...-results-may-or-may-not-tell.5357/#post-16030
http://garage.grumpysperformance.co...orsepower-from-trap-speeds-et.1814/#post-4683
http://garage.grumpysperformance.co...ing-parts-and-a-logical-plan.7722/#post-51341
"Most contemporary road tests such as Car Life criticized the slow steering, particularly without power steering, and inadequate drum brakes, which were identical to those of the normal Tempest. Car and Driver incited controversy when it printed that a GTO that had supposedly been tuned with the "Bobcat" kit offered by Ace Wilson's Royal Pontiac ofRoyal Oak, Michigan, was clocked at a quarter mile time of 12.8 seconds and a trap speed of 112 mph (180 km/h) on racing slicks. Later reports strongly suggest that the Car and Driver GTOs were equipped with a 421 cu in (6.9 L) engine that was optional in full-sized Pontiacs. Since the two engines were difficult to distinguish externally, the subterfuge was not immediately obvious. In Jim Wanger's Glory Days he admitted after three decades of denial that the red drag strip GTO had its engine swapped with a 421 Bobcat unit. Since the car was damaged during the testing, and Wangers did not want anyone looking under the hood, he used the blue road course GTO to flat tow the red GTO 1,500 miles back to Detroit. Frank Bridge's sales forecast proved inaccurate: the GTO package had sold 10,000 units before the beginning of the 1964 calendar year, and total sales were 32,450."
and the pontiac advertizing team that used a special preped "RINGER" swore for decades that GTO had a 389 cid engine ,under the hood.
the same as you could buy at any dealership, with the only change being a profesional dealer tune up, (that TUNE UP, included a bit more than swapping plugs and points the 335 hp 389 was replaced with a 405hp 421 but the result was a huge increase in GTO car sales with guys who read the magazine articles and saw the car tuning times a hemi road runner 6 years later struggled to match on street tires.
not ethical, but it sure boosted GTO sales for the next 5-6 years
look at page 4
http://www.caranddriver.com/reviews/1964-pontiac-tempest-gto-road-test-review
compare to a later test of two faster cars
http://www.caranddriver.com/compari...s-1968-chevrolet-corvette-427-comparison-test
now if you want to cry tears think about what $7K might have bought and what it would be worth now
http://www.caranddriver.com/reviews/1965-shelby-cobra-427-road-test
Last edited:
8
87vette81big
Guest
God Speed Rick.......
Just tune the Demon Carb as I would & Grumpy would himself.
Read the spark plugs.
Use all your Human Senses.
Hear.
Feel .
Smell.
See.
Use the Wideband for WOT TESTING ONLY.
Just tune the Demon Carb as I would & Grumpy would himself.
Read the spark plugs.
Use all your Human Senses.
Hear.
Feel .
Smell.
See.
Use the Wideband for WOT TESTING ONLY.
Still cannot see a significant difference in the shape of the curve.
I returned the eHole back to the first change I made from .031 to .040"
it seemed to help slightly flatten out the rich part of the curve. To go
any bigger, I will have to drill the passage behind the brass orifice.
File 2015-08-26-1841
From To
PMJ .074 .071
SMJ .080 .077
eHole Lower .060 .040
HSAB .035 .026
8
87vette81big
Guest
An Option like I stated earlier is to Replace the Demon with a 4150 series RACING HOLLEY HP Or Speciality Drag Race Carburator Builder.
its looking very good right now, you did a very good job so far !.
Thanks Mathieu..... but I still think it can be better.
can you post a graph showing ,
not time but
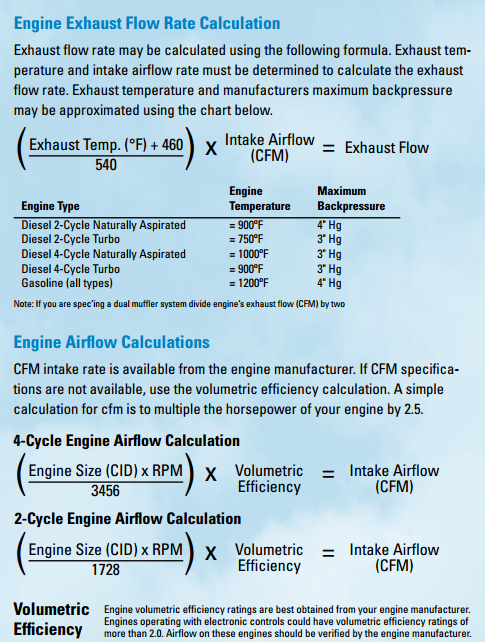
engine rpms, plenum vacuum, and ignition advance, and ideally exhaust collector pressure/vacuum readings and each exhaust primairy temperture and intake plenum fuel/air ratio?
time is rather meaningless in this tuning context,
simply because we can,t accurately gauge engine rpms vs loads and tire speeds.
RICK YOUR DOING A GREAT JOB< BUT NOT BEING ABLE TO CHECK THINGS FIRST HAND WHILE ON SITE REQUIRES ME TO ASK FOR MORE DETAILED INFO
knowing the plenum vacuum readings posted as the engine rpms change is very useful as is knowing the exhaust collector back-pressure or vacuum levels and exhaust temps,
if you could also postr cery clear pictures of the spark plug conditions as they look after a WOT run thats also potentially very useful
yeah I know im a P.I.T.A. but theres a great deal of info to be gleened from that data, IF its matched to the engine rpms and shift points, its the power curve and how and when the ignition advance curve and fuel/air ratio are changing matched to the plenum vacuum and exhaust back pressure and combustion temps that allow a good tuner to get a solid feel for how the engines making power or when and where in the power curve its being restricted or in some way limited.
if we can see a graph showing the engine rpms and shift changes matching the ignition advance and fuel/air ratio changes its very helpful
as with most things the more detailed and accurate the info, the better you can control and understand the process and the effect of changes made.
http://www.aa1car.com/library/exhaust_backpressure.htm
http://glennmessersmith.com/shiftpt.html
http://www.bgsoflex.com/shifter.html
you can,t make intelligent decisions without facts, and you get the facts by testing!
and it should be obvious that testing needs to be done under the current operational conditions at the rpm range that your concerned with.
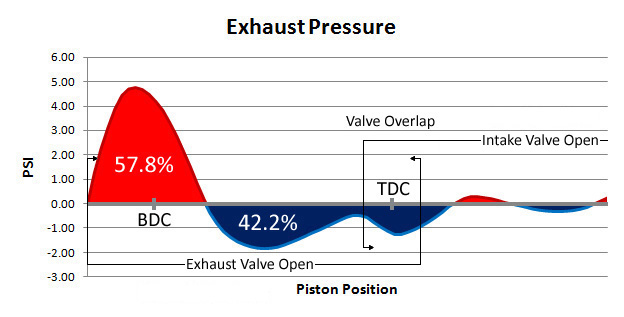
A stock automotive exhaust might have over 5 psi OF BACK PRESSURE, AT PEAK RPMS WHERE EXHAUST FLOW IS AT MAX,
or even more in a few cases, of back pressure in the exhaust system if measured at the collectors at max engine rpm, with a decent accurate pressure gauge.
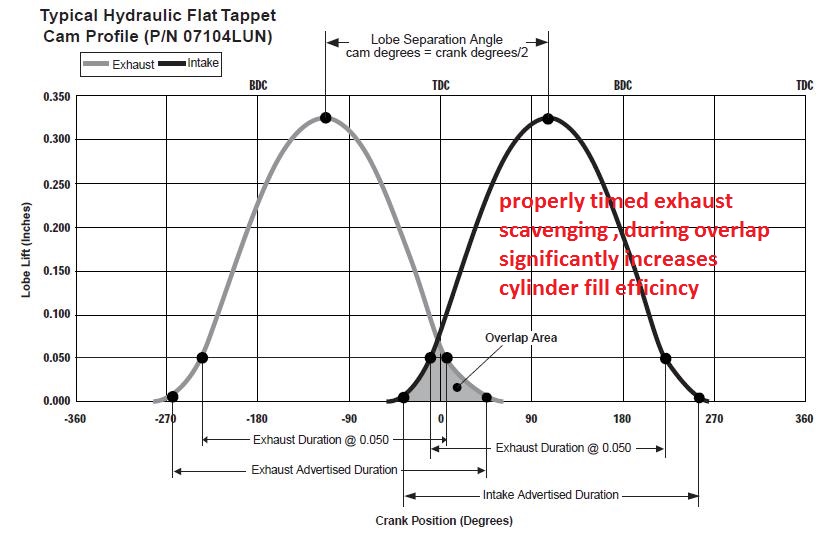
while a good aftermarket exhaust system will roughly cut that in half to the 3-5 psi range. AT MOST, BUT An excellent performance exhaust will get down in the 0--2 psi or LOWER restriction to flow range at max engine rpm. keep in mind that the efficiency of the headers scavenging the cylinders , and helping to draw in the following intake charge,is almost totally dependent on maintaining a very low flow restriction or back-pressure in the collectors ,especially at mid and upper rpm levels, any significant restriction to flow reduces the effectiveness of the headers ability to scavenge the cylinders by allowing the previous exhaust gas inertia mass to help drag in the next intake charge following it into that cylinder as it exits the cylinder thru the tuned headers primary's.
not time but
engine rpms, plenum vacuum, and ignition advance, and ideally exhaust collector pressure/vacuum readings and each exhaust primairy temperture and intake plenum fuel/air ratio?
time is rather meaningless in this tuning context,
simply because we can,t accurately gauge engine rpms vs loads and tire speeds.
RICK YOUR DOING A GREAT JOB< BUT NOT BEING ABLE TO CHECK THINGS FIRST HAND WHILE ON SITE REQUIRES ME TO ASK FOR MORE DETAILED INFO
knowing the plenum vacuum readings posted as the engine rpms change is very useful as is knowing the exhaust collector back-pressure or vacuum levels and exhaust temps,
if you could also postr cery clear pictures of the spark plug conditions as they look after a WOT run thats also potentially very useful
yeah I know im a P.I.T.A. but theres a great deal of info to be gleened from that data, IF its matched to the engine rpms and shift points, its the power curve and how and when the ignition advance curve and fuel/air ratio are changing matched to the plenum vacuum and exhaust back pressure and combustion temps that allow a good tuner to get a solid feel for how the engines making power or when and where in the power curve its being restricted or in some way limited.
if we can see a graph showing the engine rpms and shift changes matching the ignition advance and fuel/air ratio changes its very helpful
as with most things the more detailed and accurate the info, the better you can control and understand the process and the effect of changes made.
http://www.aa1car.com/library/exhaust_backpressure.htm
http://glennmessersmith.com/shiftpt.html
http://www.bgsoflex.com/shifter.html
you can,t make intelligent decisions without facts, and you get the facts by testing!
and it should be obvious that testing needs to be done under the current operational conditions at the rpm range that your concerned with.
A stock automotive exhaust might have over 5 psi OF BACK PRESSURE, AT PEAK RPMS WHERE EXHAUST FLOW IS AT MAX,
or even more in a few cases, of back pressure in the exhaust system if measured at the collectors at max engine rpm, with a decent accurate pressure gauge.
while a good aftermarket exhaust system will roughly cut that in half to the 3-5 psi range. AT MOST, BUT An excellent performance exhaust will get down in the 0--2 psi or LOWER restriction to flow range at max engine rpm. keep in mind that the efficiency of the headers scavenging the cylinders , and helping to draw in the following intake charge,is almost totally dependent on maintaining a very low flow restriction or back-pressure in the collectors ,especially at mid and upper rpm levels, any significant restriction to flow reduces the effectiveness of the headers ability to scavenge the cylinders by allowing the previous exhaust gas inertia mass to help drag in the next intake charge following it into that cylinder as it exits the cylinder thru the tuned headers primary's.
Last edited:
8
87vette81big
Guest
Ricks T-bucket may need better headers yes Grumpy.
Larger Primary Tubes and 3-1/2-4 " collectors.
Its going to be expensive.
$2,000 to start.
Then the Headers must be Chrome plated.
Larger Primary Tubes and 3-1/2-4 " collectors.
Its going to be expensive.
$2,000 to start.
Then the Headers must be Chrome plated.
8
87vette81big
Guest
Schoenfied Sprint Car Headers may work on Ricks T-bucket.
They were made for 23 degree heads in the past.
Today They are made for Brodex 18 x to Brodex 12 degree SBC Dirt track Sprint cars.
They were made for 23 degree heads in the past.
Today They are made for Brodex 18 x to Brodex 12 degree SBC Dirt track Sprint cars.
can you post a graph showing ,
not time but
engine rpms, plenum vacuum, and ignition advance, and ideally exhaust collector pressure/vacuum readings and each exhaust primairy temperture and intake plenum fuel/air ratio?
What should I use for the x & y axis?
What parameters need to be on the same graph?
The temps I assume are at idle?
RPM, vacuum/load, AFR
f you could also post very clear pictures of the spark plug conditions as they look after a WOT run that's also potentially very useful
Seems I would have to setup a table and a few tools on the side of the road to provide
that info. I will have to think about that one to see if it's possible. Is just one run going to
color the plugs enough to be useful.
You are asking for many different types of data, maybe you should start with the first
graph you would like to see and how it should be done. Do it one at a time.
to get a good grasp on the operational conditions it will require several graphs,
(YES MY COMPUTER GRAPHIC SKILS SUCK) yes your 1000 times better at it!
perhaps overlayed on the same basic back ground ,
with the line color on the graph matching the data scales on each x & Y axis with different color lines
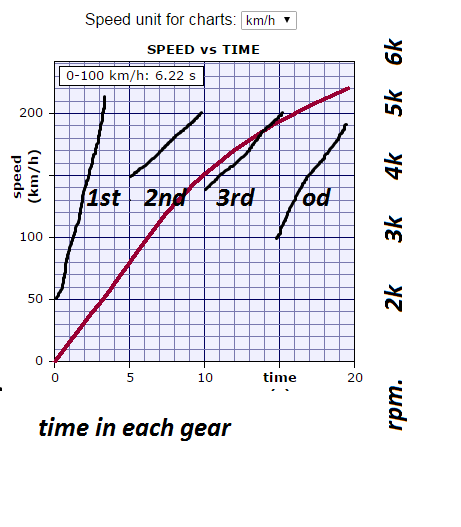
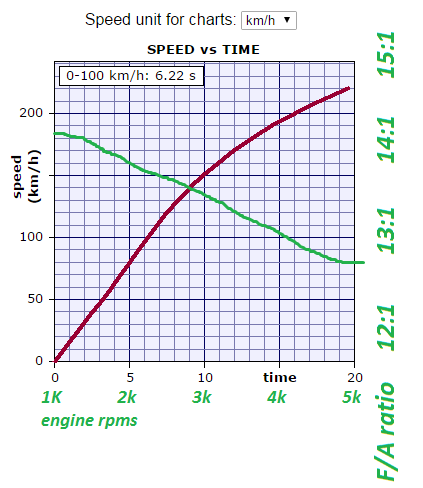
first graph
rpm in each gear,
(horizontal bar along the lower edge)
vs car speed (vertical scale)
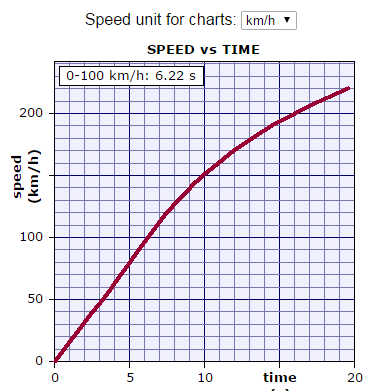
a similar SPEED VS TIME graph?
second graph
fuel/air ratio
(horizontal bar along the lower edge from 15:1-to-12:1)
vs engine rpms
(vertical scale)
third graph
fuel/air ratio
(horizontal bar along the lower edge from 15:1-to-12:1)
vs plenum vacuum
(vertical scale) probably from 17 to 1 psi vacuum
(YES MY COMPUTER GRAPHIC SKILS SUCK) yes your 1000 times better at it!
perhaps overlayed on the same basic back ground ,
with the line color on the graph matching the data scales on each x & Y axis with different color lines
first graph
rpm in each gear,
(horizontal bar along the lower edge)
vs car speed (vertical scale)
a similar SPEED VS TIME graph?
second graph
fuel/air ratio
(horizontal bar along the lower edge from 15:1-to-12:1)
vs engine rpms
(vertical scale)
third graph
fuel/air ratio
(horizontal bar along the lower edge from 15:1-to-12:1)
vs plenum vacuum
(vertical scale) probably from 17 to 1 psi vacuum
You are showing "Time" along the horizontal bar, but asking for RPM....clarify please.first graph
rpm in each gear,
(horizontal bar along the lower edge)
vs car speed (vertical scale)
a similar SPEED VS TIME graph?